The Statistician Who Learned to Forget

How a trick by a man named Welford can save your laptop, and by extension democracy, from being drowned by data.
Imagine you are a pollster. Every hour, thousands of new survey responses arrive
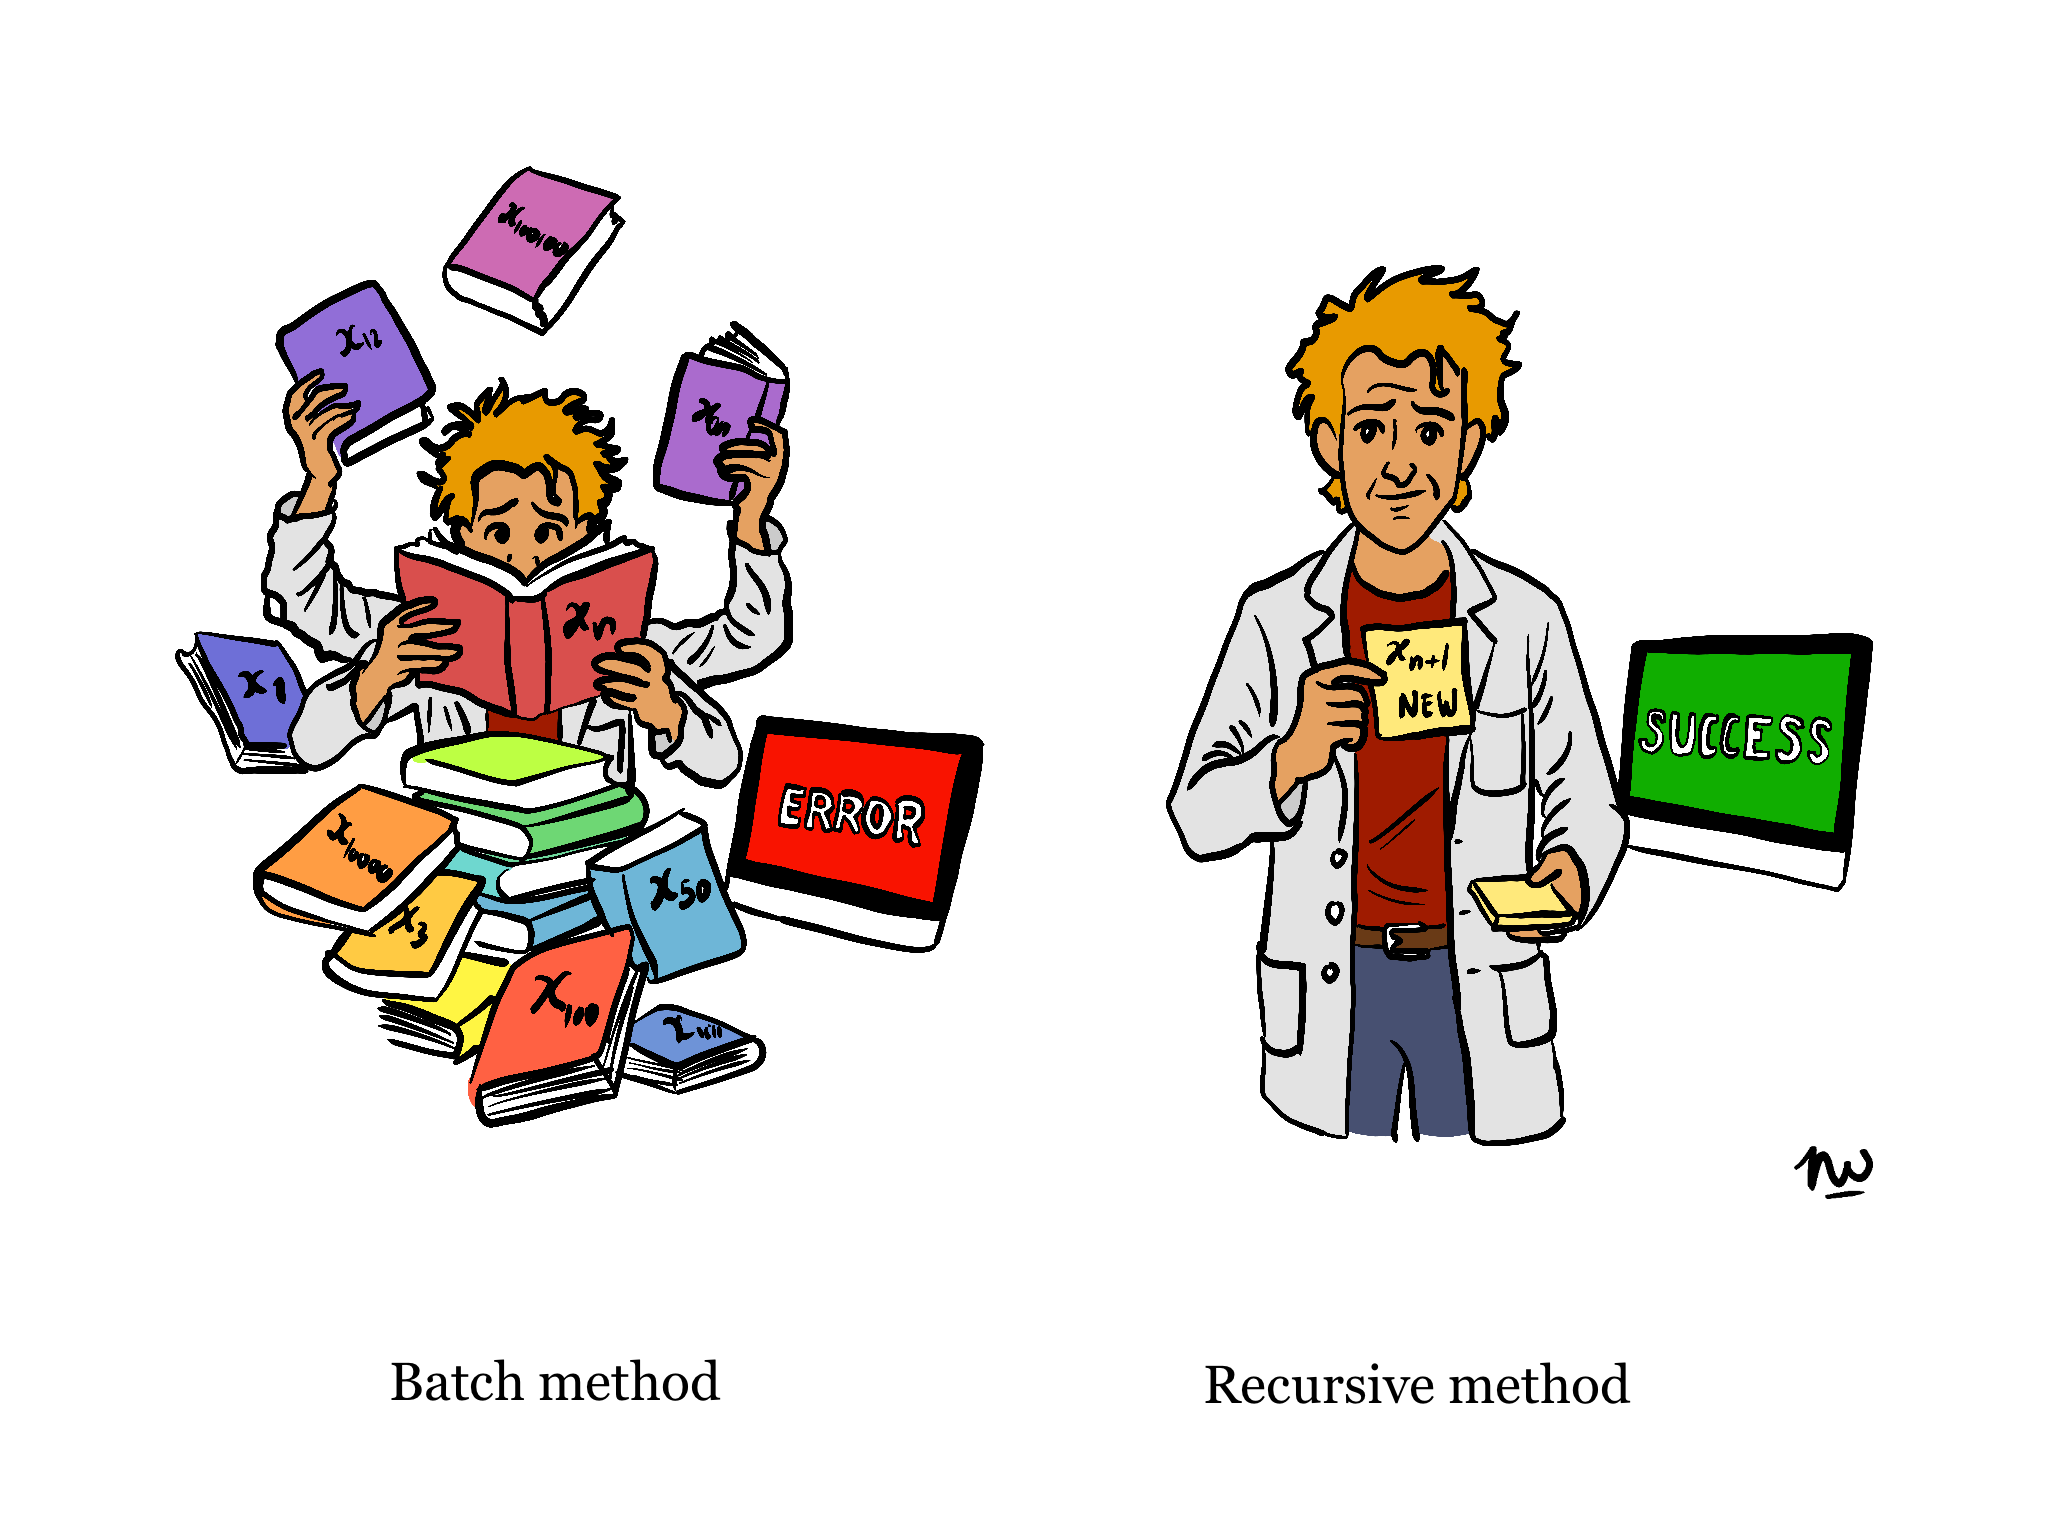
on your desk, ‘voters' opinions, market preferences, sensor readings from a smart toaster in Düsseldorf. Your job is to report the average at any moment. The old way: add everything up, divide by the elements added up, over and over again. A perfectly sensible approach, provided you have infinite memory, infinite time, and no particular wish to sleep or for spare time. Welcome to the batch method. It is exhausting for humans as well as for computers.
This is the problem that my paper sets out to solve. The paper, formally titled “Streaming Data Analytics Using Recursive Parameter Estimation”, derives a family of formulas that let you update your running statistics with nothing more than the current stored summary and the fresh data point that just arrived.
The underlying paper runs through nineteen pages of derivations. This article contains the same ideas, minus the Greek letters and the existential dread.
The problem, illustrated with soup

Consider a pot of soup. You want to know the average temperature. The batch method says: measure every spoonful you've ever taken, sum the temperatures, divide by the number of spoons you took out of the pot. But the soup is still cooking, and we assume that the temperature of the soup in the specific spoon is still the same compared to when you plunged the spoon into the pot. New spoons keep arriving. At some point you have millions of spoon measurements in a spreadsheet, and the fan of your laptop whirling like an aircraft turbine has trouble maintaining the chip at operational temperature. The recursive approach says something far more sensible and keeps your computer cool and relaxed: just remember the current average and how many spoons you've measured so far. When a new spoon arrives at temperature x, use the tidy formula derived in the paper:
\[ \overline{x}_n = \overline{x}_{n-1} + \frac{x_n - \overline{x}_{n-1}}{n} \]
That's it!
The new mean equals the old mean, nudged slightly toward the new observation. No historical record required. Your laptop breathes again. The soup is served.

Welford's elegant trick
The paper goes further than the average. Computing variance recursively is trickier. Naive approaches suffer from what statisticians call "catastrophic cancellation," which sounds dramatic, because it actually is. Subtracting two very similar large numbers in floating-point arithmetic can produce spectacular nonsense.
B.P. Welford, in 1962 published a tidy note in Technometrics that statisticians have been grateful for ever since. His key identity, re-derived in full in the paper, updates the sum of squared deviations without ever touching dangerous subtractions:
\[ S_{xx,n} = S_{xx,n-1} + (x_n - \overline{x}_{n-1})(x_n - \overline{x}_n) \]
Note the two different means: the old one and the updated one. This product form is numerically stable, algebraically equivalent to the batch variance, and very satisfying.
From variance to regression
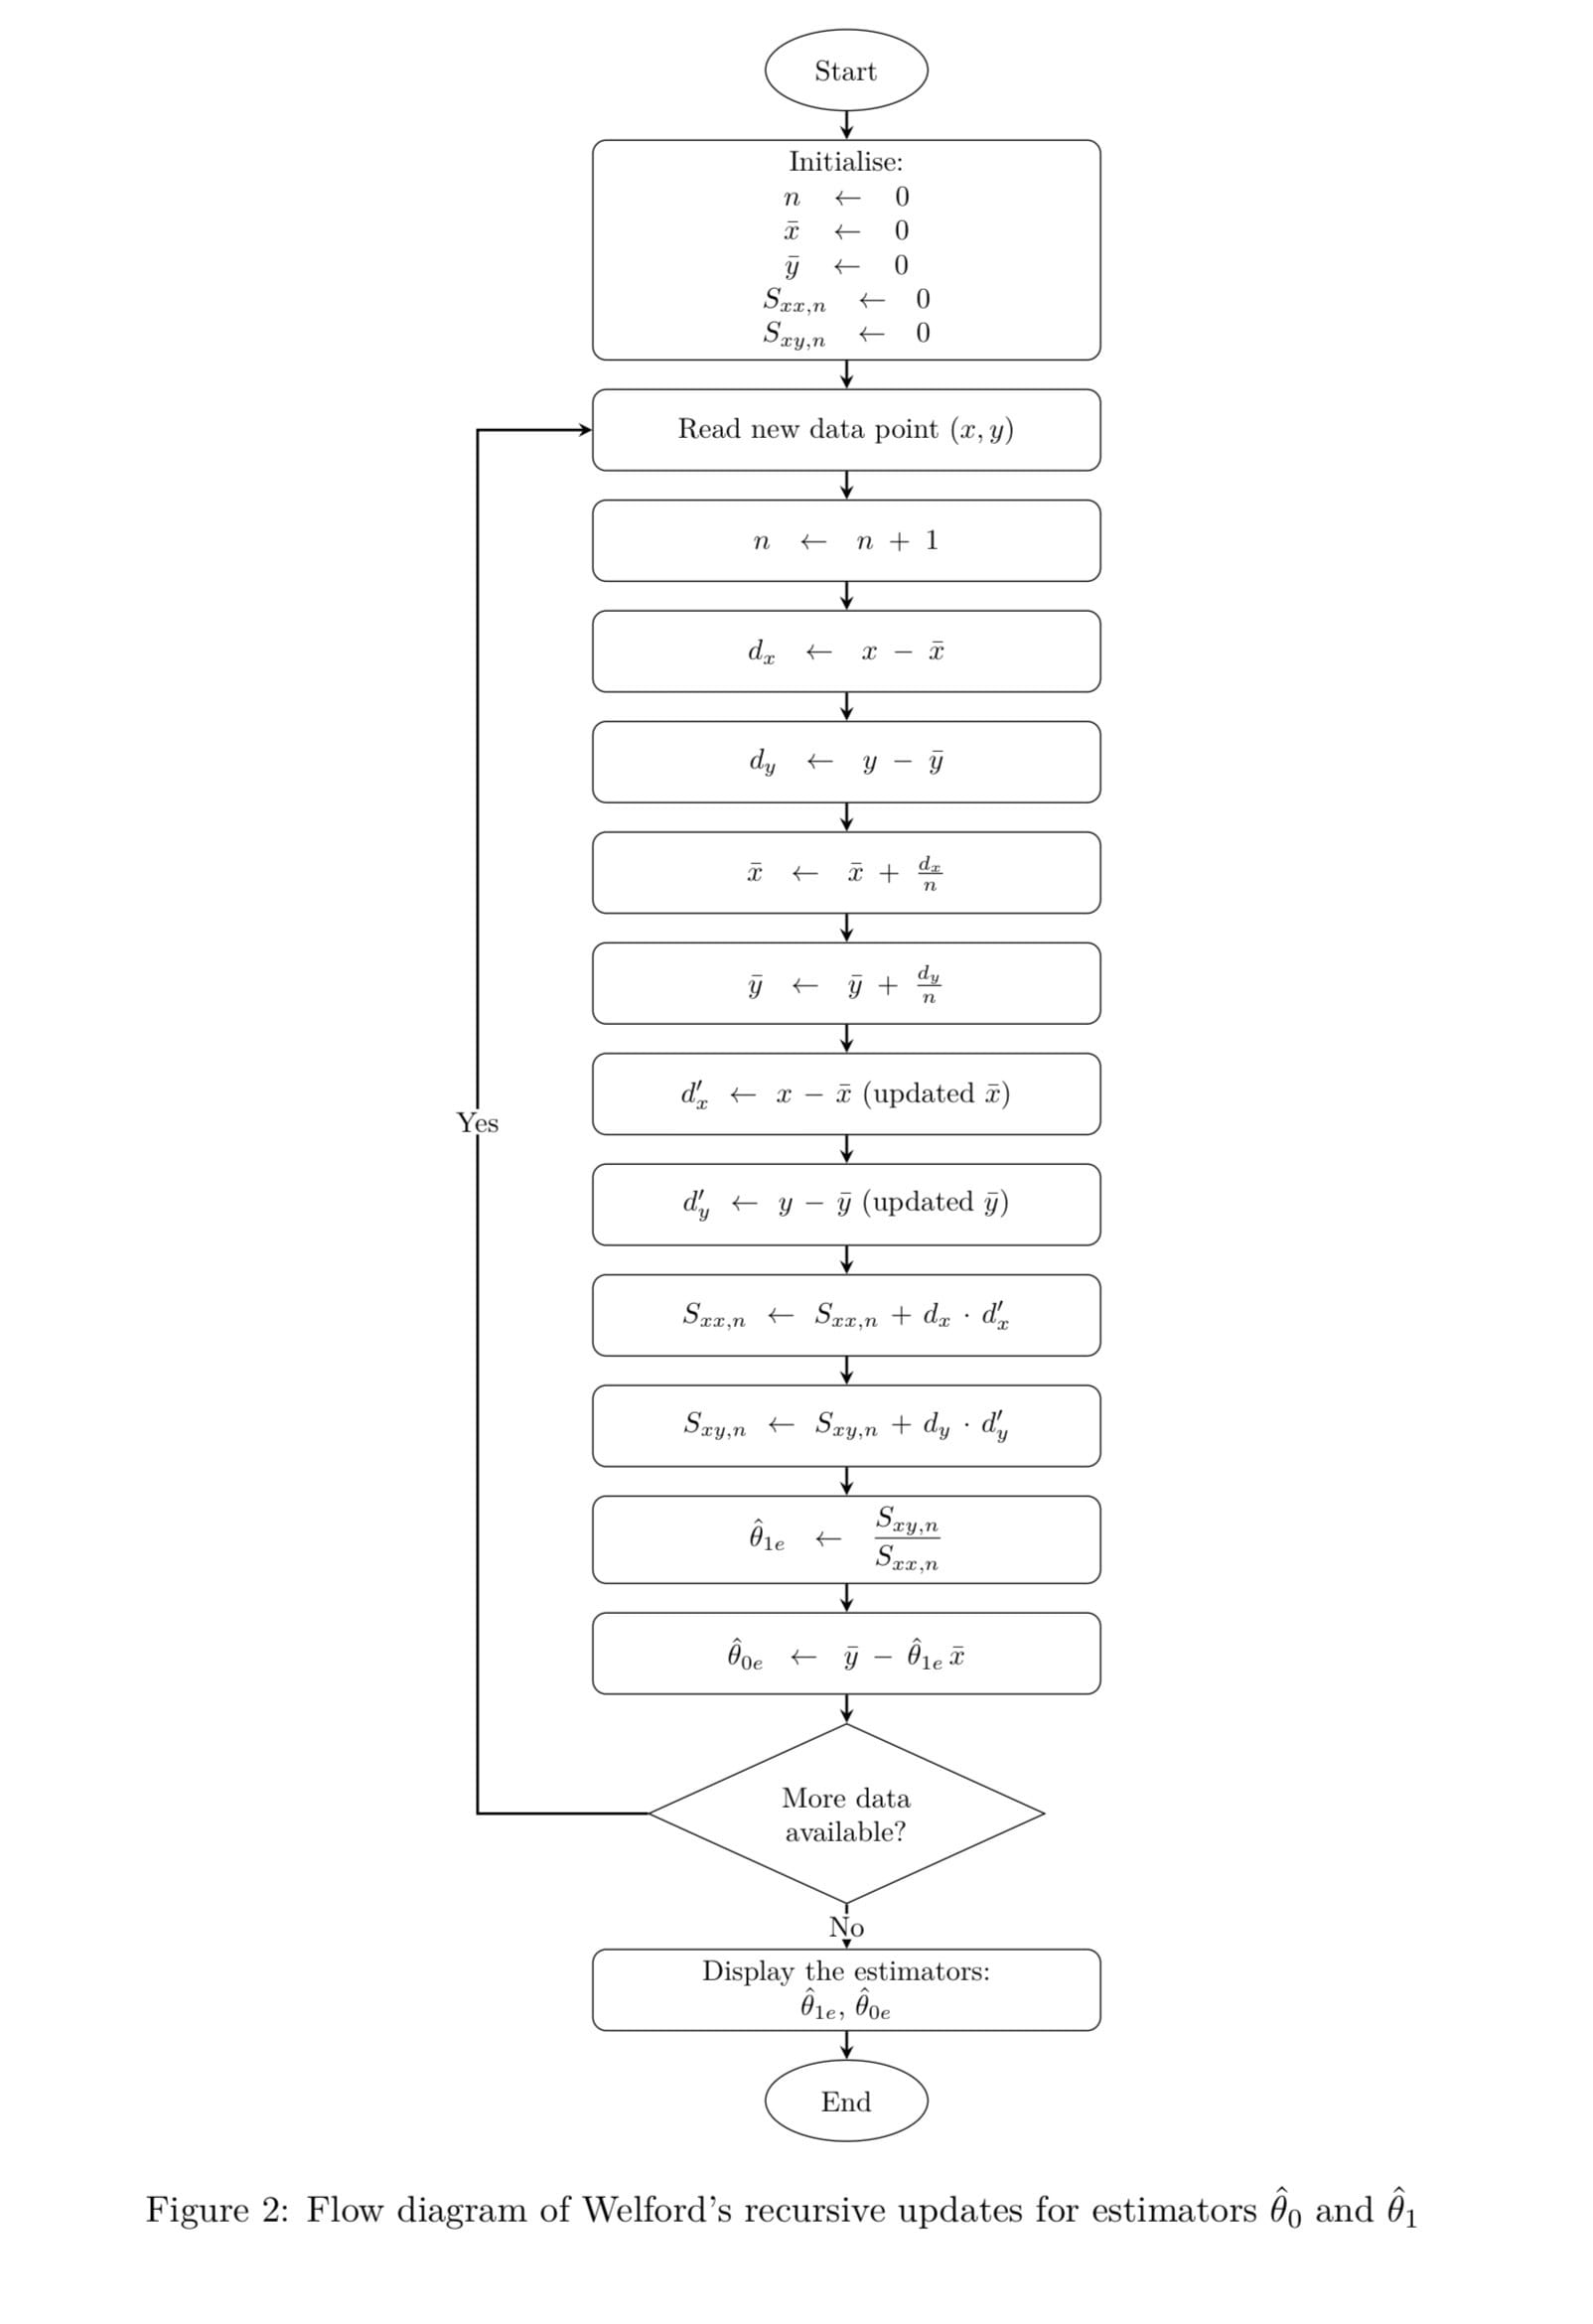
Part II of the paper is where things get genuinely interesting for anyone who does more than computing averages. Ordinary least squares regression, the bread and butter of data science, econometrics, and probably half of all political science dissertations, normally require recomputing global sums every time a new observation arrives. The paper shows that the OLS slope estimator θ!1 depends entirely on two quantities: Sxy (the cross-deviation sum) and Sxx (the sum of squared deviations in x). Both can be updated recursively using Welford-style identities. Plug in the latest (x, y) pair, update your two sums, and divide.
This might sound complicated, but the idea is that instead of restarting the whole
regression every time new data appears, you keep a small memory of the past in two numbers. Each new observation tweaks those numbers, and from them you immediately get the new slope.
This is not an approximation. It is algebraically identical to running batch OLS on the full dataset. The magic is real and the math checks out. You now have the best-fit line through all data you've ever seen, computed in constant time and constant memory.
Why should Forward College care?
Forward College is, above all, a place that thinks about governance, institutions, and the systems that shape collective life. So let's be direct about why this matters beyond your laptop’s life. Real-time data is now the hinge of democratic discourse. Election trackers, economic dashboards, public health monitors, sentiment feeds from social media, all of these are streaming systems. They need to be updated continuously, efficiently, and correctly in order to readjust action and or behaviour. The statistical machinery underneath them determines whether the numbers they show are trustworthy or quietly broken by accumulating rounding errors and batch-recomputation lag.
The paper's conclusion points toward this: "This conceptual shift connects classical
statistical theory with modern streaming and online learning paradigms." In less polished terms: the way we compute statistics is a political question too. Who gets real-time insight and who gets a spreadsheet that crashed at 80,000 rows is not a neutral technical matter.
Limitations (the honest bit)
The paper does not pretend that recursive regression can do everything. It assumes the underlying relationship between variables stays constant over time. In politics, that assumption fails roughly every election cycle. Structural breaks, the 2008 financial crisis, a pandemic, a surprise referendum result, will cause the recursive estimator to quietly keep fitting the old world, while the new one is burning.
The paper proposes, as future work, a "forgetting factor" that would discard and eliminate old data over time as new data becomes available, allowing the model to reflect current changes. This is a well-known idea in engineering (it appears in the adaptive filter literature the paper cites). Getting it right for social-science applications, where the pace of structural change is neither regular nor predictable, remains an open and genuinely hard problem.

The algorithm, for the genuinely curious
Five numbers. Constant memory. Algebraically exact. If your policy institute is running rolling regressions on quarterly data and recomputing from scratch each quarter, this paper is quietly judging you.
Conclusion
My paper “Streaming Data Analytics Using Recursive Parameter Estimation” is a piece of technical exposition. It does not claim to solve the grand problems of online learning or adaptive statistics: it makes no such pretense. What it does is however is derive, rigorously and from first principles, the minimal sufficient machinery for streaming linear regression, explain why Welford's method is superior to the naive alternative, and illustrate everything with worked numerical examples that any reader can verify by hand.
For a Forward College audience more accustomed to constitutions than covariances, the takeaway is simple: statistics that drive modern decision-making can be, and should be, updated continuously, at minimal computational cost, while being as exact as reasonably possible.
Next time someone tells you that real-time data analysis requires massive infrastructure and constant reprocessing, you may smile, recall this paper, and suggest they divide the increment by n.
References
- Westphalen, N. (2026). Streaming Data Analytics Using Recursive Parameter Estimation. Unpublished manuscript, Forward College. Available upon request: nicodeme.westphalen@forward-college.eu
- Welford, B. P. (1962). Note on a method for calculating corrected sums of squares and products. Technometrics, 4(3), 419–420.
- Illustrations by Nicodème Westphalen
Read the original submission: